Introduction
In this guide, I’ll walk you through the process of installing Wazuh on Kali Linux to monitor and analyze attack data from the DShield honeypot. Wazuh is an open-source security monitoring platform that integrates with Elasticsearch and Kibana, providing powerful SIEM (Security Information and Event Management) capabilities.
System Requirements
Before starting the installation, ensure your system meets the following requirements:
- Kali Linux (or any compatible Debian-based distribution).
- A VM or local machine with at least 2GB of RAM and 1 CPU core.
- A stable internet connection.
- A running instance of Wazuh, Elasticsearch, and Kibana.
Step 1: Update Your System
First, make sure your system is up to date by running:
sudo apt update && sudo apt upgrade -y
Step 2: Install Dependencies
Install necessary dependencies such as wget, curl, and gnupg:
sudo apt install wget curl apt-transport-https lsb-release gnupg -y
Step 3: Add Wazuh Repository
To add the Wazuh repository, download and store the GPG key in the /usr/share/keyrings/ directory:
curl -fsSL https://packages.wazuh.com/key/GPG-KEY-WAZUH | sudo tee /usr/share/keyrings/wazuh-archive-keyring.gpg > /dev/null
Now, add the Wazuh repository to your sources list:
echo "deb [signed-by=/usr/share/keyrings/wazuh-archive-keyring.gpg] https://packages.wazuh.com/4.x/apt/ stable main" | sudo tee /etc/apt/sources.list.d/wazuh.list
Update the package list:
sudo apt update
Step 4: Install Wazuh Manager
Install the Wazuh Manager, which is the core component for managing and analyzing security events:
sudo apt install wazuh-manager -y
Step 5: Install Elasticsearch (or OpenSearch)
Elasticsearch is required to store and index logs. Install Elasticsearch with the following command:
sudo apt install elasticsearch -y
If the elasticsearch package is not available in the default Kali Linux repositories, you can manually download and install it using the following steps:
- Download the Elasticsearch
.debpackage for Debian-based systems:wget https://artifacts.elastic.co/downloads/elasticsearch/elasticsearch-7.10.1-amd64.deb - Install the downloaded package:
sudo dpkg -i elasticsearch-7.10.1-amd64.deb - Install any missing dependencies:
sudo apt-get install -f - Enable and start the Elasticsearch service:
sudo systemctl enable elasticsearch sudo systemctl start elasticsearch - Verify that Elasticsearch is running:
curl -X GET "localhost:9200/"
Enable and start the Elasticsearch service:
sudo systemctl enable elasticsearch
sudo systemctl start elasticsearch
Step 6: Install Kibana
Kibana provides the user interface for visualizing and interacting with your Wazuh data. To install Kibana, run:
sudo apt install kibana -y
Step 6.5: Install Kibana Manually
- Download the Kibana
.debpackage for Debian-based systems:wget https://artifacts.elastic.co/downloads/kibana/kibana-7.10.1-amd64.deb - Install the downloaded package:
sudo dpkg -i kibana-7.10.1-amd64.deb - Install any missing dependencies:
sudo apt-get install -f - Enable and start the Kibana service:
sudo systemctl enable kibana sudo systemctl start kibana - Verify that Kibana is running: After starting the service, you can check its status:
sudo systemctl status kibana - Access Kibana: Navigate to
http://localhost:5601in your browser, or usecurlto verify:curl -X GET "localhost:5601/"
Enable and start the Kibana service:
sudo systemctl enable kibana
sudo systemctl start kibana
Step 7: Start Wazuh Manager
Enable and start the Wazuh Manager service:
sudo systemctl enable wazuh-manager
sudo systemctl start wazuh-manager
Step 8: Configure Filebeat to Forward Logs
To forward logs from your DShield honeypot to Wazuh, you need to install Filebeat on the honeypot machine:
sudo apt install filebeat -y
Edit the Filebeat configuration file to point to your Wazuh server:
sudo nano /etc/filebeat/filebeat.yml
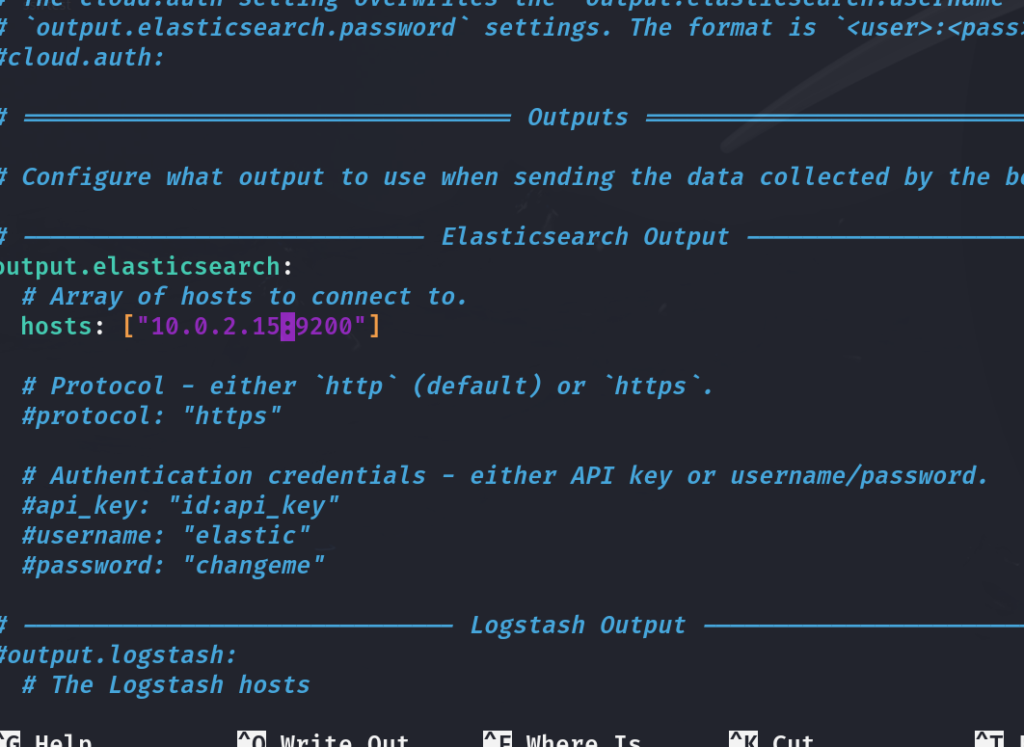
Under the output.elasticsearch section, configure it to point to your Wazuh server’s IP address:
output.elasticsearch:
  hosts: ["<10.0.2.15>:9200"]
Replace with your own host ip Save and exit the file.
Enable and start Filebeat:
sudo systemctl enable filebeat
sudo systemctl start filebeat
Step 9: Set Up Kibana Dashboards
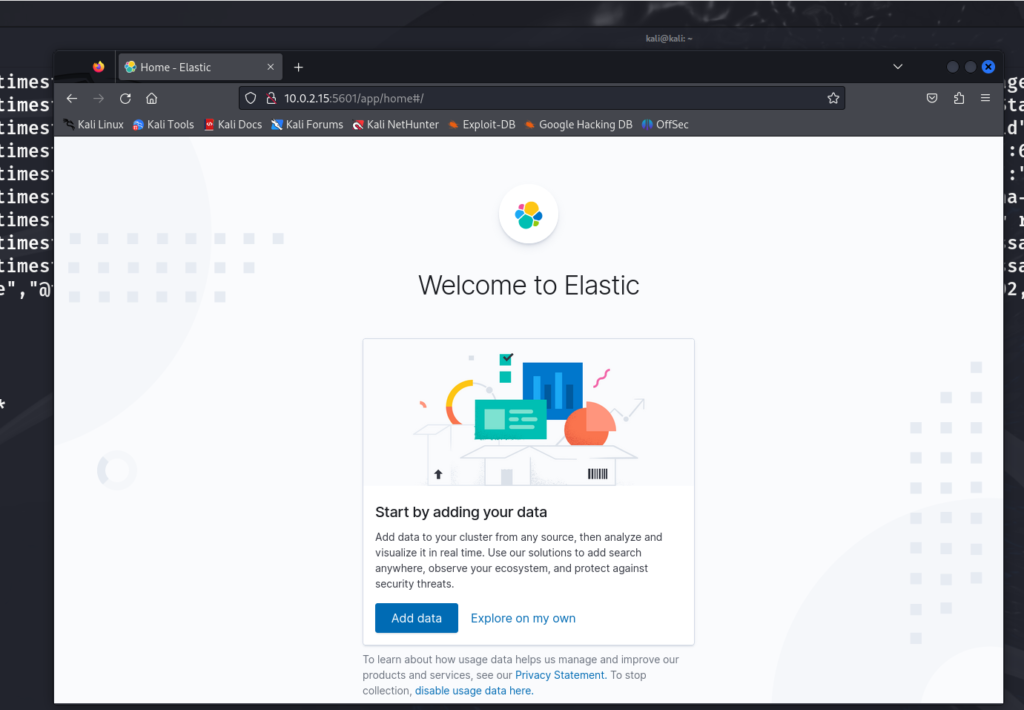
Now that Wazuh is collecting logs, you can set up custom dashboards in Kibana to visualize the attack data. Navigate to http://<WAZUH_SERVER_IP>:5601 in your web browser to access the Kibana interface.
If Kibana is only listening on localhost (127.0.0.1) and you can’t access it from other machines, follow these steps:
Access Kibana: Now, try accessing Kibana in your browser using: http://<Your-Wazuh-IP>:5601 Replace <Your-Wazuh-IP> with your Wazuh server’s IP.
Modify Kibana Configuration: Open the Kibana configuration file: sudo nano /etc/kibana/kibana.yml
Find the following line (it may be commented out with a # symbol): yamlCopyEdit# server.host: "localhost"
Uncomment the line (remove the #) and change localhost to 0.0.0.0: yamlCopyEditserver.host: "0.0.0.0"
Save and exit the editor (CTRL + X, then Y, and Enter).
Restart Kibana: Apply the changes by restarting Kibana: sudo systemctl restart kibana
Verify Kibana is Listening on All Interfaces: To ensure that Kibana is now listening on all network interfaces, run: sudo netstat -tuln | grep 5601
From there, you can access the Wazuh app within Kibana, which allows you to configure dashboards and alerts for monitoring attack data.
Step 10: Monitor and Analyze the Data
Once everything is set up, Wazuh will start receiving data from your honeypot. You can now monitor and analyze incoming attack data through Kibana’s visualizations. Use Kibana’s powerful features to view attack trends, identify patterns, and set up alerts.
Challenges and Solutions
- One of the main challenges I encountered was ensuring that Filebeat was correctly forwarding logs from my honeypot to the Wazuh server. I had to adjust file paths and configuration settings to ensure smooth log forwarding.
- Another challenge was customizing the Wazuh rules to detect specific attack behaviors, but this was resolved by fine-tuning the detection rules based on the types of attacks captured by my honeypot.
Conclusion
By setting up Wazuh on Kali Linux, I created a robust security monitoring system for analyzing the attack data from my DShield honeypot. This setup not only allows for real-time monitoring and visualization of incoming threats but also helps in detecting and responding to potential attacks more effectively.